EX-99.2
Published on April 21, 2026
Exhibit 99.2

April 21, 2026
Fellow Calix stockholders:
We are issuing this first quarter 2026 stockholder letter just ahead of our earnings call and on the eve of our 2026 Investor Day. With the migration of all customers to our AI-native third-generation platform (“Calix One”) by the end of March, we began the third stage of the Calix journey. We look forward to hosting you tomorrow where we will expand on the significance of this milestone.
The year began with strong momentum as our customers continued to invest in the Calix platform to win new subscribers, reduce churn and expand revenue per subscriber. The team also continued its strong execution and progress in helping our customers to transform and win in the markets they serve. Our first quarter 2026 results highlight that strong momentum and execution.
Calix delivered record revenue of $280 million in the first quarter of 2026—our seventh consecutive quarter of growth—representing 3% sequential growth and 27% year-over-year growth. We also guided to continued sequential growth in the second quarter, underscoring sustained platform demand we continue to see from our customers. We added 14 new platform customers, who began their transformation by leveraging our appliances, software, cloud platform and managed services to differentiate their brands within the communities they serve.
Our operational execution remained strong. Days sales outstanding were 36 days; inventory turns were 3.0, reflecting targeted inventory investments to support demand; and we generated free cash flow of $7 million. During the first quarter of 2026, we returned $171 million to shareholders in the form of share repurchases. Meanwhile, our cash and investments at the end of the first quarter of 2026 remained strong at $243 million.
Entering a Sustained Growth Phase with Calix One
One of the most significant achievements in the quarter was our launch of Calix One, anchored by Agent Workforce Cloud and SmartLife™. With the migration of all customers to Calix One, customers are now able to take advantage of AI workflows and agents as our product organization pivots from enabling AI on the platform to delivering tangible AI-driven outcomes that transform operations and accelerate differentiation to compete and win. We will highlight these developments at Investor Day tomorrow. This milestone, and our ongoing ability to invest, positions Calix to scale across new customer segments, geographies and use cases while maintaining the financial discipline that has long distinguished our company.
The clarity of our strategy, our commitment to long-term customer transformation, the launch of Calix One and our strong financial foundation continue to position Calix and our customers to benefit from a structural shift in broadband—the commoditization of speed-and-price connectivity and the broader shift that is happening across all industries as the pace of AI-induced change increases. We are ready to execute against these shifts at scale.
With Calix One now live and broadly available, Calix has entered a sustained growth phase that can extend for many years. Continued strong demand visibility reinforces our confidence in this transition.
1
The Calix Difference – Strategically Aligned Culture Delivering Long-Term Value
Building on strong first-quarter execution and the successful launch of our AI-native Calix One platform, the team continued to be recognized for our culture and innovation. In the first quarter of 2026, we earned 14 awards, including:
•TMC recognized SmartMDU as “Internet Telephony’s Product of the Year”
•Glassdoor ranked Calix 88/100 on their “Best Places to Work US” list
•Glassdoor ranked Calix 22/25 “Best Places to Work in Tech and AI” list
•TMC recognized CommandIQ for “Cybersecurity Excellence”
•Comparably ranked Calix 1/100 for “Best Company Outlook”
This quarter’s performance reflects our commitment to strengthening the Calix operating model. As industry commoditization advances in 2026, Calix One now integrates AI, cloud, software, managed services and appliances to help customers win subscribers, reduce churn and grow revenue per user. We continue this unified approach to drive better customer outcomes and support sustainable growth as we expand into MDUs, new geographies and private deployments. Our focus remains on delivering long-term results through four clear objectives.
•Deliberate revenue growth
•Gross margin expansion
•Disciplined operating expense investment
•Ongoing predictability
We look forward to discussing these priorities in greater detail at our Investor Day tomorrow morning at the New York Stock Exchange. The webcast will begin at 10:00 a.m. ET and will be available on the Calix Investor Relations website.
First Quarter 2026 Financial Results
| GAAP | Non-GAAP | Guidance Non-GAAP 1 | |||||||||
| Revenue | $280.0m | $280.0m | $275.0m – $281.0m | ||||||||
| Gross margin | 56.9% | 57.2%2 | 56.25% – 58.25% | ||||||||
| Operating expenses | $146.6m | $127.0m2 | $127.0m – $129.0m | ||||||||
| Net income per diluted common share | $0.16 | $0.402 | $0.34 – $0.40 | ||||||||
1 | Non-GAAP guidance provided on January 28, 2026. | ||||
2 | Non-GAAP excludes stock-based compensation, net of the effect for income taxes. See GAAP to non-GAAP reconciliations beginning on page 14. | ||||
2
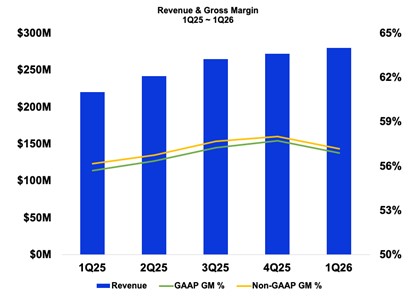
For the first quarter of 2026, revenue was $280.0 million, representing an increase of 3% from the prior quarter and an increase of 27% compared with the same quarter a year ago. We observed continued strong and broad-based demand from our customers during the quarter.
U.S. revenue was 95% of revenue for the first quarter of 2026 compared to 94% in the prior quarter and down from 96% for the year ago quarter. U.S. revenue increased 4% sequentially and increased 26% compared with the year ago quarter. International revenue was 5% of revenue in the first quarter of 2026, down 14% sequentially and up 62% compared with the year ago period. The sequential decrease in international revenue was primarily due to lower shipments to a European customer.
GAAP gross margin for the first quarter of 2026 was 56.9%, a decrease of 80 basis points sequentially and an increase of 120 basis points year-over-year. Excluding stock-based compensation, our non-GAAP gross margin for the first quarter of 2026 was 57.2%, a decrease of 80 basis points sequentially and an increase of 100 basis points from the year ago period. The sequential decreases in GAAP and non-GAAP gross margin related to our investment in dual cloud environments to support customer migrations to our third-generation cloud platform (which is now complete). The GAAP and non-GAAP year-over-year gross margin increases relate primarily to continued adoption of our platform by our customers and their winning new subscribers. U.S. tariff and tariff-related costs were not material to first quarter 2026 results.
Software revenue includes AXOS software licenses, which are recognized as delivered, and our SaaS offerings of Calix One (Agent Workforce Cloud and SmartLife™), which are recognized ratably over the service period. Service revenue includes customer success, support and warranty, which are recognized ratably over the service period, and professional services, which are recognized as delivered. Our software enables customers to benefit from the power of data-driven insights and improve their average revenue per user at higher margins with the greatest levels of subscriber satisfaction to drive best-in-class Net Promoter Scores℠. Our SmartLife managed services include: SmartHome™ (which includes Bark, Wi-FiIQ, CommandIQ®, ProtectIQ®, ExperienceIQ® and HomeOfficeIQ™), SmartBiz™, SmartMDU™ and SmartTown®.
3
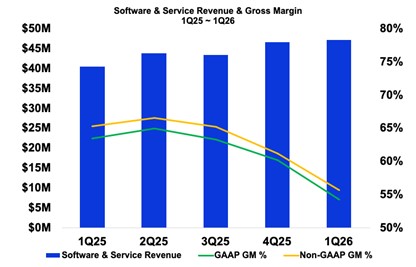
During the first quarter of 2026, software and service revenue was $47.1 million, increases of 1% sequentially and 16% compared with the year ago quarter. The smaller sequential growth rate related to fewer days in the first quarter of 2026 relative to the fourth quarter of 2025 (87 days vs. 95 days). The year-over-year increase related to continued strong demand year-over-year for software licenses, Calix Cloud and SmartLife managed services and to a lesser extent service revenue.
Software and service GAAP gross margin in the first quarter of 2026 was 54.3%, representing a decrease of 590 basis points sequentially and 920 basis points from the year ago period. Excluding stock-based compensation, software and service non-GAAP gross margin for the first quarter of 2026 was 55.7%, representing a decrease of 560 basis points sequentially and 960 basis points from the year ago period. The sequential and year-over-year decreases related primarily to the transition from our second-generation platform to our third-generation platform during which time we operated in a dual cloud environment to successfully support customer migrations. We substantially completed this transition in the first quarter with no material impacts expected from dual clouds on our future quarterly results.
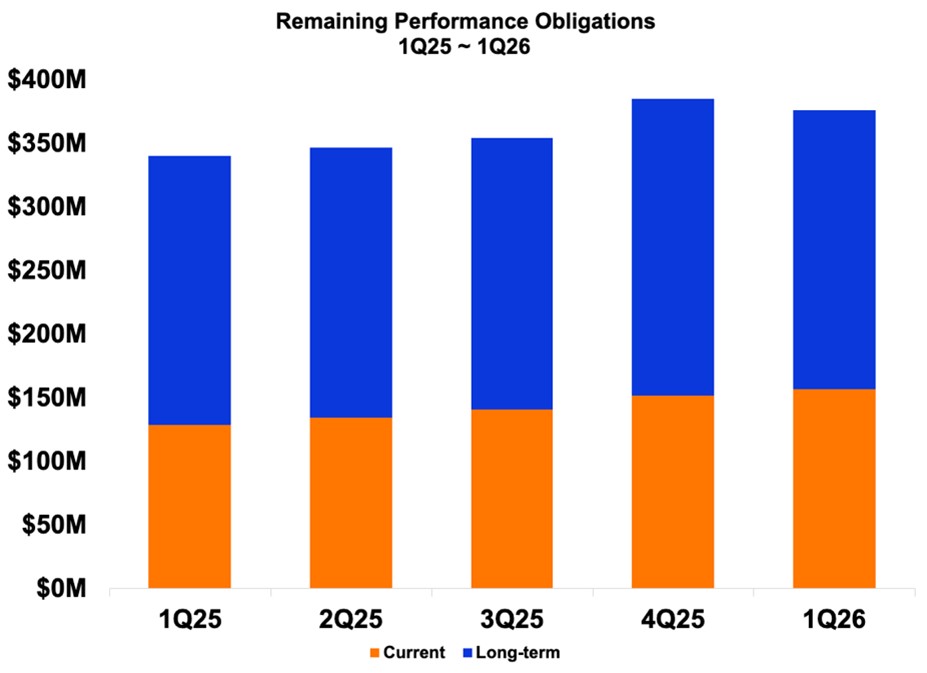
RPOs result from long-term commitments made by our customers and consist mainly of Calix Cloud, SmartLife managed services, extended warranties and support/maintenance agreements and exclude AXOS software licenses, month-to-month usage-based models and true-ups to actual usage from minimum commitments. These minimum commitments generally have a three-year term at signing.
At the end of the first quarter of 2026, our RPOs were $376.3 million, a decrease of $8.7 million, or 2%, from the prior quarter and an increase of $35.9 million, or 11%, from the same quarter a year ago. The sequential decrease in RPOs was due to our focus on migrating customers to our third-generation cloud platform. Our current RPOs were a record $156.7 million, up $5.2 million, or 3% from the prior quarter
4
and up $28.3 million, or 22%, from the year-ago quarter. RPOs and current RPOs increased year-over-year due to strong demand for our cloud and managed services model. Our ability to deliver agentic workflows occurred only after customers migrated to our third-generations platform. As such, we expect the growth in RPOs will accelerate in the second half of 2026 as we begin to deliver agentic workflows and demonstrate the value of Calix One and its ability to transform broadband businesses.
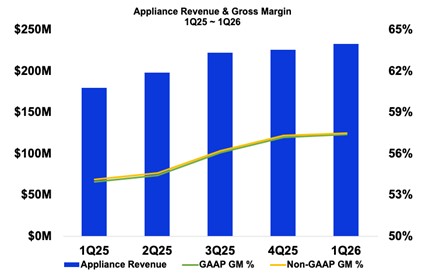
During the first quarter of 2026, appliance revenue, which includes our Access Edge, Experience Edge appliances and related optics, was $232.8 million, an increase of 3% sequentially and 30% compared with the year ago quarter on continued adoption of our platform. Our customers that adopt our appliance-based platform can quickly pivot toward improving the subscriber experience, thereby enabling them to improve their average revenue per user at higher margins with the greatest levels of subscriber satisfaction.
Appliance GAAP gross margin in the first quarter of 2026 was 57.4%, representing an increase of 20 basis points sequentially and an increase of 340 basis points from the year ago period. Excluding stock-based compensation, appliance non-GAAP gross margin in the first quarter of 2026 was 57.5%, representing an increase of 10 basis points sequentially and an increase of 330 basis points from the year ago period. The sequential and year-over-year increases relate primarily to the adoption of our platform and growing market share for network and on-premises appliances that are the foundation for the adoption of our software and services.
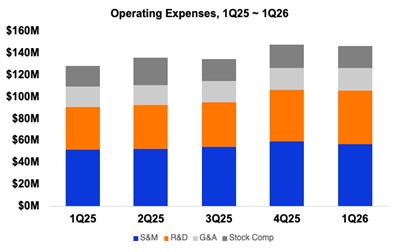
Our GAAP and non-GAAP operating expenses for the first quarter of 2026 were $146.6 million and $126.9 million, representing 52% and 45% of revenue, respectively. Sequentially, GAAP operating expenses decreased by $1.4 million primarily due to stock-based compensation, and non-GAAP operating expenses were relatively flat sequentially but higher than typical for the first quarter due
5
primarily to investments in our agentic platform. Compared with the year ago quarter, GAAP operating expenses increased by $17.8 million and non-GAAP operating expenses increased by $17.1 million primarily related to increased investments in platform innovation. Non-GAAP sales and marketing investments were 20% of revenue, which was in-line with our Target Financial Model range of 18% to 20%. Non-GAAP research and development investments were 30% of gross profit, which is above our Target Financial Model of 29% as we invest in Agent Workforce cloud. Non-GAAP general and administrative investments were 8% of revenue, which is above our Target Financial Model of 7% and was the result of a leadership meeting in January 2026.
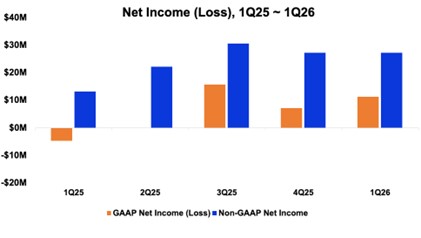
Our GAAP net income was $11.2 million for the first quarter of 2026, a sequential increase of $4.0 million and an improvement of $16.0 million from the year ago period. The sequential increase was primarily the result of higher revenue and lower operating expenses and GAAP income taxes. GAAP net income for the first quarter of 2026 included stock-based compensation of $20.6 million. Excluding stock-based compensation, our non-GAAP net income was $27.2 million, a decrease of $0.1 million compared with the prior quarter due to higher revenue and gross profit offset by lower interest and other income and higher operating expenses. Non-GAAP net income increased $14.1 million, when compared with net income of $13.1 million in the year ago quarter due to higher revenue and gross margin.
Balance Sheet and Cash Flow
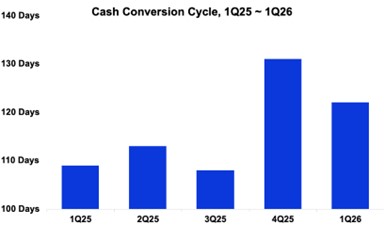
Our balance sheet remained strong. Our DSO in the first quarter of 2026 was 36 days, up 1 day from the prior quarter and up 6 days from the year ago period, reflecting continued strong shipment linearity. Our Target Financial Model for DSO remains between 35 and 45 days. Inventory turns were 3.0, in-line with the prior quarter and down from 3.6 a year ago. The year-over-year decrease in inventory turns represents investments in inventory to address the robust demand environment and supply chain trends. Inventory turns were within our Target Financial Model of 3 to 4 turns. Days payable outstanding (DPO) at the end of the first quarter was 37 days, up 11 days from the prior quarter and up 14 days from the year
6
ago quarter. Our Target Financial Model for DPO is between 25 and 35 days. Our cash conversion cycle was 122 days compared with 131 days in the prior quarter and 109 days in the same quarter last year. Our Target Financial Model for our cash conversion cycle remains between 100 and 130 days.
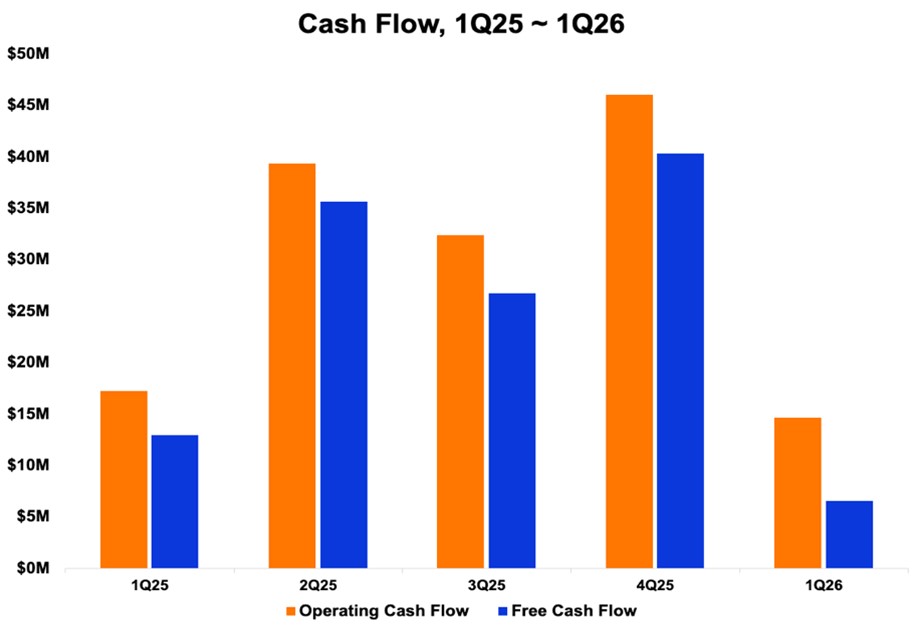
We ended the first quarter of 2026 with cash and investments of $243.3 million, a sequential decrease of $144.8 million. The decrease was primarily due to our common stock repurchases of 3.3 million shares for $170.9 million and capital expenditures of $8.1 million partially offset by proceeds from equity-based employee benefit plans of $20.0 million and quarterly operating cash inflows of $14.6 million. We continue to expect both GAAP operating and non-GAAP free cash flow to remain strong due to continued non-GAAP profitability and a robust cash conversion cycle.
The remaining common stock repurchase authorization at the end of the first quarter of 2026 was $63 million.
Second Quarter 2026 Guidance
| Guidance Non-GAAP | Guidance Reconciled to GAAP | |||||||
| Revenue | $287m – $293m | $287m – $293m | ||||||
| Gross margin | 54.25% – 57.25%1 | 53.95% – 56.95% | ||||||
| Operating expenses | $127.0m – $129.0m1 | $148.0m – $150.0m | ||||||
Net income per diluted common share2 | $0.35 – $0.451 | $0.11 – $0.21 | ||||||
1 | Non-GAAP excludes stock-based compensation as well as the income tax impact of these items. See GAAP to non-GAAP reconciliation on page 16. | ||||
2 | Based on 66.5 million weighted-average diluted common shares outstanding. | ||||
Our guidance for the second quarter of 2026, ending June 27, 2026, reflects our expectations as of the date of this letter.
Our revenue guidance for the second quarter of 2026 is for revenue to be between $287 million and $293 million, up 4% (at the midpoint) from the prior quarter taking into consideration the robust demand and visibility that we are experiencing across our customer base as well as taking into consideration the revenue impact from assessed surcharges to help partially offset memory component price increases. We expect our annual revenue to grow between 15% and 20% this year.
Our non-GAAP gross margin guidance for the second quarter of 2026 of 55.8% (at the midpoint) is down 140 basis points from the previous quarter. This decline is primarily due the increase in memory
7
component costs and to a lesser extent to customer and product mix partially offset by memory surcharges and the improvement in software and service gross margin after completing customer migrations to the third-generation cloud platform and winding down the second-generation cloud platform. We expect our non-GAAP gross margin to be down by 50 to 150 basis points in 2026, reflecting the impact from memory surcharges, memory component costs not absorbed by surcharges and incremental cloud costs associated with the migration of customers to our latest platform.
Our non-GAAP operating expense guidance for the second quarter of 2026 of $128.0 million (at the midpoint) represents a sequential increase primarily related to accelerating the development of AI functionality and capabilities of our platform, cloud and managed services into the first half of 2026. We expect to return to our Target Financial Model for operating expenses by the fourth quarter of 2026.
We continue to expect our non-GAAP effective tax rate for 2026 will be in a range of 23% to 25%.
Summary
The Calix team is excited to enter this next period of growth as customers turn to AI-native Calix One and a partnership with our Customer Success teams to transform operations and accelerate differentiation to compete and win. The third generation of our platform, including Agent Workforce Cloud, SmartMDU and our third-generation mobile app, represents the culmination of 15 years of investment and learning in partnership with our customers.
Our demand visibility is at a near all-time high, and we are pairing that momentum with an AI-enabled internal transformation to evolve how we operate and serve customers. As we build execution readiness to scale Calix One across our base and into new markets, we are embracing new customer segments such as MDU, new sovereign geographies and new private platform customers to compete and win for years to come.
The foundation for our growth continues to be based on three consistent vectors:
•Winning new subscribers: customers leverage our platform, cloud and managed services to differentiate themselves in their markets thereby adding subscribers.
•Growing existing subscriber revenue while reducing churn: customers adopt additional platform extensions, cloud and managed services, enabling them to reduce their operational costs, reduce churn and grow revenue per subscriber.
•Adding new customers: We continue to help legacy operators and operators in new customer segments and geographies become strategically-aligned experience providers who recognize that our unique platform, cloud and managed services model enables their teams to transform their business as they transform operations, subscriber engagement and services, accelerate differentiation across consumer, business and municipal subscribers and compete to win for members, investors and the communities they serve.
With strong demand for the Calix One platform, we are confident in our sequential revenue growth and excited by the multi-year outlook for our business. We appreciate the ongoing support of our customers, employees, partners, vendors, and shareholders, and we are eager to engage in meaningful strategic discussions during tomorrow’s investor day.
Sincerely,
8
 Michael Weening President and CEO |  Cory Sindelar CFO | |||||||
Conference Call
In conjunction with this announcement, Calix will host a conference call today, April 21, 2026 at 2:00 p.m. Pacific Time / 5:00 p.m. Eastern Time to answer questions regarding our first quarter 2026 financial results. A live audio webcast and replay of the call will be available in the Investor Relations section of the Calix website at http://investor-relations.calix.com. Live call access information: Dial-in number: (877) 407-4019 (U.S.) or (201) 689-8337 (outside the U.S.) ID# 13759279.
Investor Day 2026
A live webcast and replay of Calix’s 2026 Investor Day held tomorrow, April 22, 2026, at 7:00 a.m. Pacific Time / 10:00 a.m. Eastern Time will be available in the Investor Relations section of the Calix website at https://investor-relations.calix.com/.
The conference call and webcasts will include forward-looking information.
Investor Inquiries
Nancy Fazioli
VP, Investor Relations
InvestorRelations@calix.com
(669) 308-3901
About Calix
Calix, Inc. (NYSE: CALX) is an AI platform company that enables service providers to transform their operations and accelerate delivery of differentiated experiences—so they can compete and win in the markets and communities they serve.
Through the AI-native Calix One platform, service providers can securely and privately activate agentic-AI alongside their human teams to acquire new subscribers, grow existing subscriber revenue, and build loyalty across residential, business, municipal, and MDU markets. More than 1,200 customers of all sizes leverage the Calix One platform, which has evolved over 15 years at an investment of more than $2 billion.
Calix innovation cycles are underpinned by a strong financial balance sheet and a people-first culture that routinely earns broad industry recognition—winning 81 culture and innovation awards since 2025 alone, as well as Fortune’s 100 Best Companies to Work For® in 2026.
Forward-Looking Statements
Statements made in this stockholder letter and the earnings call referencing the stockholder letter that are not statements of historical fact are forward-looking statements. Forward-looking statements are subject to the “safe harbor” provisions of the Private Securities Litigation Reform Act of 1995. Forward-looking statements relate to, but are not limited to, impact from U.S. tariffs and trade policies, potential customer or market opportunities, growth and future opportunities, customer demand or the sustainability of continued demand, anticipated customer purchase trends, anticipated government funding, programs
9
and proposals, expected customer and product mix or anticipated adoption or deployment of our appliances, platform, cloud or managed services, implementation of agentic AI, industry, market and customer trends, opportunities with existing and prospective customers, the timing of BEAD shipments, free cash flow and liquidity, continuation of our stock repurchase program and future financial performance (including the outlook for the second quarter of 2026, full year and future periods and performance against our Target Financial Model). Forward-looking statements are subject to risks and uncertainties that could cause actual results to differ materially from expectations, including but not limited to fluctuations in our financial and operating results, the capital spending decisions of our customers, U.S. tariffs, changes and disruptions in the market and industry, availability of capital in the market, potential for growth in our business driven by government funds, changes in and impacts of regulations and/or government sponsored programs, competition, our ability to achieve market acceptance of our appliances, platform, cloud or managed services, our ability to grow our customer base, our ability to implement agentic AI across our platform to scale our customer success team and our customers’ success, fluctuations in costs associated with our appliances and services including higher costs, dependence on third-parties for production and resource management associated with our global supply chain that may cause delays in production, inventory write-offs or component liabilities, cost overruns, disruptions in global trade and relations, social unrest and political uncertainties and other unanticipated factors, as well as the risks and uncertainties described in our annual report on Form 10-K and our quarterly reports on Form 10-Q, each as filed with the SEC and available at www.sec.gov, particularly in the sections titled “Risk Factors.” Forward-looking statements speak only as of the date the statements are made and are based on information available to us at the time those statements are made and/or management’s good faith belief as of that time with respect to future events. Calix assumes no obligation to update forward-looking statements to reflect actual performance or results, changes in assumptions or changes in other factors affecting forward-looking information, except to the extent required by applicable securities laws. Accordingly, investors should not place undue reliance on any forward-looking statements.
Use of Non-GAAP Financial Information
The Company uses certain non-GAAP financial measures in this stockholder letter to supplement its consolidated financial statements, which are presented in accordance with U.S. GAAP. These non-GAAP measures include non-GAAP gross margin, non-GAAP operating expenses, non-GAAP sales and marketing investments, non-GAAP research and development investments, non-GAAP general and administrative investments, non-GAAP effective income tax rate, non-GAAP net income or profitability, non-GAAP net income per diluted common share and non-GAAP free cash flow. These non-GAAP measures are provided to enhance the reader’s understanding of the Company’s operating performance as they exclude non-cash stock-based compensation and intangible asset amortization and the impact from changes in income taxes, which the Company believes are not indicative of its core operating results. Management believes that the non-GAAP measures used in this stockholder letter provide investors with important perspectives into the Company’s ongoing business performance and management uses these non-GAAP measures to evaluate financial results and to establish operational goals. The presentation of these non-GAAP measures is not meant to be a substitute for results presented in accordance with GAAP but rather should be evaluated in conjunction with those GAAP results. A reconciliation of the non-GAAP results to the most directly comparable GAAP results is provided in this stockholder letter. The non-GAAP financial measures used by the Company may be calculated differently from, and therefore may not be comparable to, similarly titled measures used by other companies.
10
| Calix, Inc. | ||||||||||||||||||||
| Condensed Consolidated Statements of Operations | ||||||||||||||||||||
| (Unaudited, in thousands, except per share data) | ||||||||||||||||||||
| Three Months Ended | ||||||||||||||||||||
| March 28, | March 29, | |||||||||||||||||||
| 2026 | 2025 | |||||||||||||||||||
| Revenue: | ||||||||||||||||||||
| Appliance | $ | 232,843 | $ | 179,743 | ||||||||||||||||
| Software and service | 47,141 | 40,499 | ||||||||||||||||||
| Total revenue | 279,984 | 220,242 | ||||||||||||||||||
| Cost of revenue: | ||||||||||||||||||||
| Appliance | 99,136 | 82,745 | ||||||||||||||||||
| Software and service | 21,552 | 14,789 | ||||||||||||||||||
| Total cost of revenue | 120,688 | 97,534 | ||||||||||||||||||
| Gross profit | 159,296 | 122,708 | ||||||||||||||||||
| Operating expenses: | ||||||||||||||||||||
| Sales and marketing | 63,486 | 58,059 | ||||||||||||||||||
| Research and development | 54,646 | 43,980 | ||||||||||||||||||
| General and administrative | 28,448 | 26,750 | ||||||||||||||||||
| Total operating expenses | 146,580 | 128,789 | ||||||||||||||||||
| Operating income (loss) | 12,716 | (6,081) | ||||||||||||||||||
| Interest income and other expense, net: | ||||||||||||||||||||
| Interest income, net | 2,858 | 3,287 | ||||||||||||||||||
| Other expense, net | (342) | (196) | ||||||||||||||||||
| Total interest income and other expense, net | 2,516 | 3,091 | ||||||||||||||||||
| Income (loss) before income taxes | 15,232 | (2,990) | ||||||||||||||||||
| Income taxes | 4,022 | 1,797 | ||||||||||||||||||
| Net income (loss) | $ | 11,210 | $ | (4,787) | ||||||||||||||||
| Net income (loss) per common share: | ||||||||||||||||||||
| Basic | $ | 0.17 | $ | (0.07) | ||||||||||||||||
| Diluted | $ | 0.16 | $ | (0.07) | ||||||||||||||||
| Weighted average number of shares used to compute net income (loss) per common share: | ||||||||||||||||||||
| Basic | 65,690 | 66,027 | ||||||||||||||||||
| Diluted | 68,570 | 66,027 | ||||||||||||||||||
11
| Calix, Inc. | ||||||||||||||
| Condensed Consolidated Balance Sheets | ||||||||||||||
| (Unaudited, in thousands) | ||||||||||||||
| March 28, | December 31, | |||||||||||||
| 2026 | 2025 | |||||||||||||
| ASSETS | ||||||||||||||
| Current assets: | ||||||||||||||
| Cash and cash equivalents | $ | 54,601 | $ | 143,086 | ||||||||||
| Marketable securities | 188,688 | 245,018 | ||||||||||||
| Accounts receivable, net | 116,772 | 99,367 | ||||||||||||
| Inventory | 154,626 | 133,737 | ||||||||||||
| Prepaid expenses and other current assets | 72,487 | 70,345 | ||||||||||||
| Total current assets | 587,174 | 691,553 | ||||||||||||
| Property and equipment, net | 38,998 | 37,812 | ||||||||||||
| Right-of-use operating leases | 13,662 | 14,665 | ||||||||||||
| Deferred tax assets | 164,719 | 165,636 | ||||||||||||
| Goodwill | 116,175 | 116,175 | ||||||||||||
| Other assets | 30,680 | 32,681 | ||||||||||||
| $ | 951,408 | $ | 1,058,522 | |||||||||||
LIABILITIES AND STOCKHOLDERS’ EQUITY | ||||||||||||||
| Current liabilities: | ||||||||||||||
| Accounts payable | $ | 69,122 | $ | 41,523 | ||||||||||
| Accrued liabilities | 78,555 | 91,339 | ||||||||||||
| Deferred revenue | 30,800 | 30,386 | ||||||||||||
| Total current liabilities | 178,477 | 163,248 | ||||||||||||
| Long-term portion of deferred revenue | 19,708 | 19,890 | ||||||||||||
| Operating leases | 11,860 | 12,756 | ||||||||||||
| Other long-term liabilities | 3,386 | 3,409 | ||||||||||||
| Total liabilities | 213,431 | 199,303 | ||||||||||||
| Stockholders’ equity: | ||||||||||||||
| Common stock | 1,610 | 1,678 | ||||||||||||
| Additional paid-in capital | 1,098,541 | 1,230,191 | ||||||||||||
| Accumulated other comprehensive loss | (1,142) | (408) | ||||||||||||
| Accumulated deficit | (361,032) | (372,242) | ||||||||||||
| Total stockholders’ equity | 737,977 | 859,219 | ||||||||||||
| $ | 951,408 | $ | 1,058,522 | |||||||||||
12
| Calix, Inc. | ||||||||||||||
| Condensed Consolidated Statements of Cash Flows | ||||||||||||||
| (Unaudited, in thousands) | ||||||||||||||
| Three Months Ended | ||||||||||||||
| March 28, | March 29, | |||||||||||||
| 2026 | 2025 | |||||||||||||
| Operating activities: | ||||||||||||||
| Net income (loss) | $ | 11,210 | $ | (4,787) | ||||||||||
| Adjustments to reconcile net income (loss) to net cash provided by operating activities: | ||||||||||||||
| Stock-based compensation | 20,605 | 19,745 | ||||||||||||
| Depreciation and amortization | 4,376 | 4,271 | ||||||||||||
| Deferred income taxes | 1,274 | (1,459) | ||||||||||||
| Net accretion of available-for-sale securities | (435) | (1,144) | ||||||||||||
| Changes in operating assets and liabilities: | ||||||||||||||
| Accounts receivable, net | (17,405) | 3,810 | ||||||||||||
| Inventory | (20,889) | 1,891 | ||||||||||||
| Prepaid expenses and other assets | 804 | 2,808 | ||||||||||||
| Accounts payable | 26,243 | 3,486 | ||||||||||||
| Accrued liabilities | (10,298) | (14,086) | ||||||||||||
| Deferred revenue | 232 | 3,158 | ||||||||||||
| Other long-term liabilities | (1,083) | (481) | ||||||||||||
| Net cash provided by operating activities | 14,634 | 17,212 | ||||||||||||
Investing activities: | ||||||||||||||
| Purchases of property and equipment | (8,118) | (4,310) | ||||||||||||
| Purchases of marketable securities | (10,038) | (36,856) | ||||||||||||
| Sales of marketable securities | 24,621 | — | ||||||||||||
| Maturities of marketable securities | 41,388 | 52,154 | ||||||||||||
| Net cash provided by investing activities | 47,853 | 10,988 | ||||||||||||
| Financing activities: | ||||||||||||||
| Proceeds from common stock issuances related to employee benefit plans | 19,999 | 10,845 | ||||||||||||
| Repurchases of common stock | (170,869) | (39,974) | ||||||||||||
| Net cash used in financing activities | (150,870) | (29,129) | ||||||||||||
| Effect of exchange rate changes on cash and cash equivalents | (102) | 67 | ||||||||||||
| Net decrease in cash and cash equivalents | (88,485) | (862) | ||||||||||||
| Cash and cash equivalents at beginning of period | 143,086 | 43,162 | ||||||||||||
| Cash and cash equivalents at end of period | $ | 54,601 | $ | 42,300 | ||||||||||
13
| Calix, Inc. | |||||||||||||||||||||||||||||||||||||||||||||||||||||||||||||||||||||||||||||||||||||||||
| Reconciliation of GAAP to Non-GAAP Gross Margin | |||||||||||||||||||||||||||||||||||||||||||||||||||||||||||||||||||||||||||||||||||||||||
| (Unaudited) | |||||||||||||||||||||||||||||||||||||||||||||||||||||||||||||||||||||||||||||||||||||||||
| Three Months Ended | |||||||||||||||||||||||||||||||||||||||||||||||||||||||||||||||||||||||||||||||||||||||||
| March 28, 2026 | December 31, 2025 | September 27, 2025 | June 28, 2025 | March 29, 2025 | |||||||||||||||||||||||||||||||||||||||||||||||||||||||||||||||||||||||||||||||||||||
| Appliance | Software and service | Total | Appliance | Software and service | Total | Appliance | Software and service | Total | Appliance | Software and service | Total | Appliance | Software and service | Total | |||||||||||||||||||||||||||||||||||||||||||||||||||||||||||||||||||||||||||
| GAAP gross margin | 57.4 | % | 54.3 | % | 56.9 | % | 57.2 | % | 60.2 | % | 57.7 | % | 56.1 | % | 63.3 | % | 57.3 | % | 54.4 | % | 65.0 | % | 56.3 | % | 54.0 | % | 63.5 | % | 55.7 | % | |||||||||||||||||||||||||||||||||||||||||||||||||||||||||||
| Adjustments to GAAP amount: | |||||||||||||||||||||||||||||||||||||||||||||||||||||||||||||||||||||||||||||||||||||||||
| Stock-based compensation | 0.1 | 1.4 | 0.3 | 0.2 | 1.1 | 0.3 | 0.1 | 1.0 | 0.3 | 0.2 | 1.0 | 0.4 | 0.2 | 1.0 | 0.4 | ||||||||||||||||||||||||||||||||||||||||||||||||||||||||||||||||||||||||||
| Intangible asset amortization | — | — | — | — | — | — | — | 0.9 | 0.1 | — | 0.5 | 0.1 | — | 0.8 | 0.1 | ||||||||||||||||||||||||||||||||||||||||||||||||||||||||||||||||||||||||||
| Non-GAAP gross margin | 57.5 | % | 55.7 | % | 57.2 | % | 57.4 | % | 61.3 | % | 58.0 | % | 56.2 | % | 65.2 | % | 57.7 | % | 54.6 | % | 66.5 | % | 56.8 | % | 54.2 | % | 65.3 | % | 56.2 | % | |||||||||||||||||||||||||||||||||||||||||||||||||||||||||||
| Calix, Inc. | ||||||||||||||||||||||||||||||||
| Reconciliation of GAAP to Non-GAAP Operating Expenses | ||||||||||||||||||||||||||||||||
| (Unaudited, in thousands) | ||||||||||||||||||||||||||||||||
| Three Months Ended | ||||||||||||||||||||||||||||||||
| March 28, | December 31, | September 27, | June 28, | March 29, | ||||||||||||||||||||||||||||
| 2026 | 2025 | 2025 | 2025 | 2025 | ||||||||||||||||||||||||||||
| GAAP operating expenses: | ||||||||||||||||||||||||||||||||
| Sales and marketing | $ | 63,486 | $ | 66,667 | $ | 60,257 | $ | 63,653 | $ | 58,059 | ||||||||||||||||||||||
| Research and development | 54,646 | 53,534 | 47,055 | 45,787 | 43,980 | |||||||||||||||||||||||||||
| General and administrative | 28,448 | 27,827 | 27,293 | 26,464 | 26,750 | |||||||||||||||||||||||||||
| 146,580 | 148,028 | 134,605 | 135,904 | 128,789 | ||||||||||||||||||||||||||||
| Stock-based compensation: | ||||||||||||||||||||||||||||||||
| Sales and marketing | (6,649) | (7,059) | (6,158) | (11,047) | (6,469) | |||||||||||||||||||||||||||
| Research and development | (5,889) | (6,400) | (5,965) | (5,890) | (5,081) | |||||||||||||||||||||||||||
| General and administrative | (7,172) | (7,782) | (7,742) | (7,912) | (7,415) | |||||||||||||||||||||||||||
| (19,710) | (21,241) | (19,865) | (24,849) | (18,965) | ||||||||||||||||||||||||||||
| Non-GAAP operating expenses: | ||||||||||||||||||||||||||||||||
| Sales and marketing | 56,837 | 59,608 | 54,099 | 52,606 | 51,590 | |||||||||||||||||||||||||||
| Research and development | 48,757 | 47,134 | 41,090 | 39,897 | 38,899 | |||||||||||||||||||||||||||
| General and administrative | 21,276 | 20,045 | 19,551 | 18,552 | 19,335 | |||||||||||||||||||||||||||
| $ | 126,870 | $ | 126,787 | $ | 114,740 | $ | 111,055 | $ | 109,824 | |||||||||||||||||||||||
14
| Calix, Inc. | |||||||||||||||||||||||||||||||||||
| Reconciliation of GAAP Net Income (Loss) to Non-GAAP Net Income | |||||||||||||||||||||||||||||||||||
| (Unaudited, in thousands) | |||||||||||||||||||||||||||||||||||
| Three Months Ended | |||||||||||||||||||||||||||||||||||
| March 28, | December 31, | September 27, | June 28, | March 29, | |||||||||||||||||||||||||||||||
| 2026 | 2025 | 2025 | 2025 | 2025 | |||||||||||||||||||||||||||||||
| GAAP net income (loss) | $ | 11,210 | $ | 7,212 | $ | 15,658 | $ | (199) | $ | (4,787) | |||||||||||||||||||||||||
| Adjustments to GAAP amount: | |||||||||||||||||||||||||||||||||||
| Stock-based compensation | 20,605 | 22,012 | 20,618 | 25,613 | 19,745 | ||||||||||||||||||||||||||||||
| Intangible asset amortization | — | — | 381 | 228 | 298 | ||||||||||||||||||||||||||||||
| Income tax effect of non-GAAP adjustments | (4,579) | (1,959) | (6,071) | (3,398) | (2,125) | ||||||||||||||||||||||||||||||
| Non-GAAP net income | $ | 27,236 | $ | 27,265 | $ | 30,586 | $ | 22,244 | $ | 13,131 | |||||||||||||||||||||||||
| Calix, Inc. | ||||||||||||||||||||||||||||||||
| Non-GAAP Free Cash Flow Reconciliation | ||||||||||||||||||||||||||||||||
| (Unaudited, in thousands) | ||||||||||||||||||||||||||||||||
| Three Months Ended | ||||||||||||||||||||||||||||||||
| March 28, | December 31, | September 27, | June 28, | March 29, | ||||||||||||||||||||||||||||
| 2026 | 2025 | 2025 | 2025 | 2025 | ||||||||||||||||||||||||||||
| Net cash provided by operating activities | $ | 14,634 | $ | 46,046 | $ | 32,314 | $ | 39,381 | $ | 17,212 | ||||||||||||||||||||||
| Purchases of property and equipment | (8,118) | (5,765) | (5,625) | (3,735) | (4,310) | |||||||||||||||||||||||||||
| Non-GAAP free cash flow | $ | 6,516 | $ | 40,281 | $ | 26,689 | $ | 35,646 | $ | 12,902 | ||||||||||||||||||||||
| Calix, Inc. | ||||||||
Reconciliation of GAAP Net Income to Non-GAAP Net Income Per Diluted Common Share1 | ||||||||
| (Unaudited) | ||||||||
| Three Months Ended March 28, 2026 | ||||||||
| GAAP net income per diluted common share | $ | 0.16 | ||||||
| Adjustments to GAAP amount: | ||||||||
| Stock-based compensation | 0.30 | |||||||
Income tax effect of non-GAAP adjustments | (0.06) | |||||||
| Non-GAAP net income per diluted common share | $ | 0.40 | ||||||
1 | Based on 68.6 million weighted-average diluted common shares outstanding. | ||||
15
| Calix, Inc. | ||||||||||||||||||||
| Reconciliation of GAAP to Non-GAAP Guidance | ||||||||||||||||||||
| (Unaudited, dollars in thousands, except per share data) | ||||||||||||||||||||
| Three Months Ending June 27, 2026 | ||||||||||||||||||||
| GAAP | Stock-Based Compensation | Non-GAAP | ||||||||||||||||||
| Gross margin | 53.95% - 56.95% | 0.3% | 54.25% - 57.25% | |||||||||||||||||
| Operating expenses | $148,000 - $150,000 | $(21,000) | $127,000 - $129,000 | |||||||||||||||||
Net income per diluted common share1 | $0.11 - $0.21 | $0.24 2 | $0.35 - $0.45 | |||||||||||||||||
1 | Based on 66.5 million weighted-average diluted common shares outstanding. | ||||
2 | Net of income taxes. | ||||
16