EXHIBIT 99.2
Published on November 5, 2018
Exhibit 99.2

November 5, 2018
Fellow Calix stockholders:
Our mission is to connect everyone and everything. Calix platforms empower our customers to build new business models, rapidly deploy new services and make the promise of the smart home and business a reality. In the third quarter of 2018, we continued to make steady progress on our mission. We expanded our addressable market and added 33 new customers. This expansion of customers demonstrates the value of our all-platform product offerings. In addition, we broadened our relationship with key customers, enhanced and extended our product portfolio and honed our service offerings, all while dramatically improving our operating leverage.
Another Quarter of Solid Progress Through Our Transformation
Our relentless focus on the transformation of Calix into a communications cloud and software platform, systems and services business yielded further progress in the third quarter. As we stated in last quarter’s letter, over the long term we believe these achievements will manifest in improved financial performance across four measurable metrics:
• | Gross margin expansion |
• | Disciplined operating expense investment |
• | Deliberate revenue growth |
• | Increased predictability |
We are happy to report in the third quarter we continued to deliver on these objectives and expect these metrics will continue to improve as our platforms increase as a percentage of our total business. We will continue to take every opportunity to simplify our business and increase our focus on our all-platform offerings.
Examples of our progress made in the quarter were:
• | All financial metrics in guidance ranges except for net income per diluted common share which was above our range, and operating cash flow, which was positive. |
• | Continued traction for Calix Cloud as we closed a record number of customer agreements driving Calix Cloud revenue up by a high double-digit percentage sequentially. |
• | Announced UK-based CityFibre chose AXOS to enable advanced capabilities, network intelligence and automation across its national fiber network as it builds out its multi-gigabit network in the UK to as many as five million households through 2025. |
• | Unabated momentum by customers adopting our mesh-enhanced carrier class Wi-Fi solutions and established a new quarterly benchmark with more than 600 service providers purchasing the solution year to date. |
• | Further expansion of our customer base as we added 33 new customers, bringing our year to date total to 99. These new customers include operators from nearly every service provider segment. |
Platforms Built to Ride the Coming Wave of Disruption
Our vision is focused on providing the platforms and services that enable innovative service providers to create services at a DevOps pace and provide their subscribers with an exceptional experience. Service providers achieve this objective by building their infrastructure and service offerings on platforms. The ongoing wave of disruption sweeping across the communications space remains unprecedented in our experience. We continue to see traditional business models being disrupted as service providers of all types learn to adapt to the needs of the device-enabled subscriber. We believe the winning service providers in the future will be those who relentlessly focus on providing an exceptional experience for their customers. As we demonstrated again this quarter, these service providers continue to find our Calix Cloud, EXOS and AXOS platforms enable them to win and increase the value of their businesses. We in turn are doing the same as we gain greater leverage from our platforms business as demonstrated once again this quarter through improved financial results.
1
Our focus remains on finding like-minded customers regardless of their legacy type, size or location. This expansion of our total addressable market and diversification of our customer base resulted in stronger financial performance in the quarter as gains in our all-platform product portfolio delivered value greater than the declines in our legacy product portfolio. Therefore, we are once again pleased to discuss our results for the quarter.
Third Quarter 2018 Financial Results
Actual GAAP | Actual Non-GAAP | Guidance Non-GAAP | |
Revenue | $114.7M | $114.7M | $111 - $115M |
Gross margin | 46.1% | 46.2% (1) | 45.0 - 47.0% (1) |
Operating expenses | $52.2M | $50.0M (1) | $50.0 - $52.0M (1) |
Net income per diluted common share | $0.02 | $0.06 (1) | $0.00 - $0.04 (1) |
Operating cash flow | $7.9M | Positive | Negative |
(1) Excludes the impact from non-GAAP items consisting of stock-based compensation and a restructuring benefit. See reconciliations to GAAP below.
Results in the quarter were within or better than our guidance. Revenue, gross margin and net income all increased sequentially, while we were able to reduce operating expenses both year-over-year and sequentially. Total revenue increased sequentially benefiting from solid demand for our platforms, ramps of new offerings with both domestic and international customers as well as increased customer diversity partially offset by declines in our legacy systems portfolio. New products and continued diversification of our customer base offset a decline in gross margin for our services business and helped drive overall GAAP and non-GAAP gross margin up over 50 basis points sequentially. Importantly, we increased our revenue while improving our operating leverage. Operating expenses declined both year-over-year and sequentially and were at the low end of expectations as we continue to reap the benefits of our all-platform model. This led to a reported net income per diluted common share above the high end of our expectations.
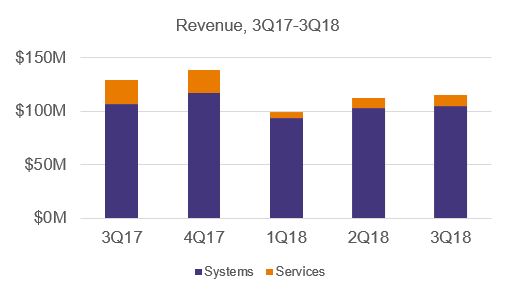
Systems revenue decreased 1% compared to the year ago period as a result of less CAF2-related turnkey network deployment project revenue. We saw continued traction with our AXOS and Calix Cloud platforms partially offsetting declines in our traditional systems revenue. Compared to the prior quarter, systems revenue increased 3% owing to strength in our Tier 2 customers. Services revenue decreased nearly 60% compared to the year ago quarter as we continue to align our services business with our all-platform model. Similar to last quarter, we faced a challenging comparison with the year ago quarter as we saw lower levels of CAF2-related turnkey deployment revenue. CAF2-related work continues as customers drive to meet 2018 milestones. However, the absolute level of activity is lower in 2018 relative to 2017. Compared to the prior quarter, services revenue was relatively flat as we continue to deliver CAF-related services.
Domestic revenue was 87% of total revenue for the quarter and decreased 16% compared to the year ago period due to the just noted challenging comparison with the year ago period. Revenue from large customers also decreased significantly compared to the year ago period due to the challenging comparison as well as the ongoing merger-related slowdown in capital spending by one major customer in the current period. This was once again partially offset by continued shipments to a large, North America-based service provider as they build out their next generation network. Revenue from medium-sized customers increased meaningfully relative to the year ago period as project-specific spending picked up. Revenue from small and regional operators increased substantially compared to the year ago quarter led by strength in Calix Cloud, AXOS and traditional systems along with CAF-related program builds. International revenue was 13% of total revenue and increased 39% year over
2
year as the team continues to focus on finding strategically-aligned customers for our all-platform business including new international customers announced this quarter such as CityFibre and Housing Development Corporation of Maldives.
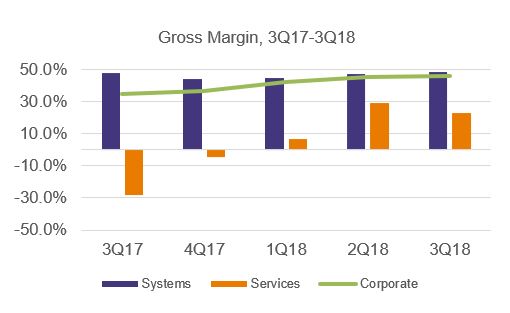
Overall gross margin continued to improve in the quarter owing to favorable product and customer mix as well as the benefit our platforms provide as they continue to make up a greater portion of our revenue mix. We saw benefits from continued customer diversification and improved systems mix driven by our all-platform offerings. The increase in systems gross margin more than offset the sequential decline in services gross margin. Systems gross margin increased both compared to the prior quarter and to the year ago quarter on both a GAAP and non-GAAP basis. The principal drivers of the improved systems gross margin were continued growth in our all-platform offerings, customer diversification and mix. Services gross margin on both a GAAP and non-GAAP basis improved dramatically this quarter compared to the year ago quarter as the team again executed well against current contracts after the process improvements and efficiencies implemented in 2017. Compared to the prior quarter, services gross margin declined due to a higher volume of third-party costs related to CAF installations compared to services rendered by Calix resources.
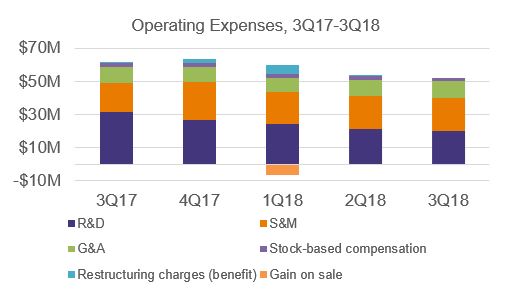
Operating expenses for the quarter were at the low-end of expectations on both a GAAP and non-GAAP basis as the team focused on maintaining disciplined investment while continuing to drive accelerated innovation for our customers. Importantly, once again this quarter, we were able to support a sequential increase in revenue, while reporting lower absolute levels of operating expenses. Compared to the year ago quarter, both GAAP and non-GAAP operating expenses decreased by more than 14%. Relative to the year ago period, these decreases reflect the combined restructuring activities from 2017 and 2018 and demonstrates the leverage of our all-platform offerings which enable a lower level of incremental research and development investment while driving a higher level of platform innovations that allow us to introduce new offerings at a DevOps pace. As demonstrated this quarter with our all-platform model, we expect to continue to improve our operating expense leverage, while maintaining an accelerated pace of innovation.
3
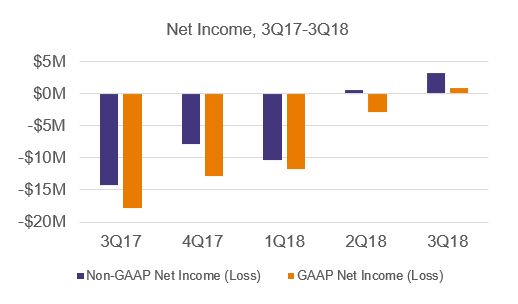
Profitability continued its dramatic improvement as the Calix team remained focused on realizing the leverage of our all-platform model. This improvement was driven primarily by reduced investments in research and development, improved services execution, results from restructuring and the ramp of our new offerings. GAAP profitability improved by more than $18.0 million year-over-year from a net loss of $17.9 million to net profit of $0.8 million. Sequentially, GAAP profitability improved by nearly $4.0 million. Likewise, non-GAAP profitability increased by more than $17.0 million year-over-year from a net loss of $14.2 million to a net profit of $3.2 million. Sequentially, non-GAAP profit improved by nearly $3.0 million. As a reminder, GAAP results include stock-based compensation, restructuring charges (benefit) and gain on the sale of a product line.
Balance Sheet and Cash Flow
We ended the quarter with cash of $53.0 million, a sequential increase of $4.8 million. The sequential increase in our cash was primarily the result of positive operating cash flow driven by our net income and favorable changes in working capital partially offset by capital investments. Compared to the year ago quarter, our cash and investment balance declined by $17.8 million due to negative operating cash flow reported over the past twelve months of $28.9 million and capital investments of $6.8 million partially offset by the proceeds from the sale of our outdoor cabinet product line of $10.4 million in the first quarter of 2018 and the proceeds from employee stock purchase plans of $8.0 million.
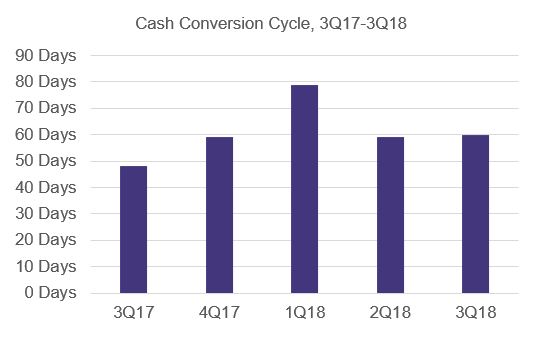
Our team’s focus on operational excellence resulted in outstanding balance sheet metrics. Accounts receivable days sales outstanding at quarter end were 54 days - 3 days less than prior quarter and 23 days more than prior year, reflecting the timing of advanced CAF2 payments in advance of when revenue was recognized last year. Inventory turns were 8.5 at quarter end. This compares to 8.9 turns in the prior quarter and 8.0 turns in the year ago quarter. Accounts payable days at quarter end were 37 days down 2 days from the prior quarter and up 8 days from the year ago quarter as we look to keep our cash conversion cycle within our expected range. Our cash conversion cycle was 60 days compared to 59 days in the prior quarter and 48 days in the year ago quarter.
4
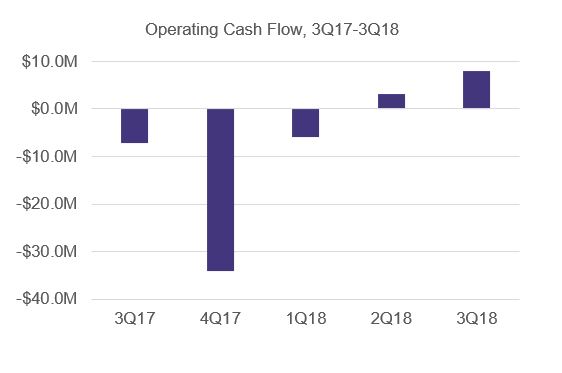
Operating cash flow for the third quarter was $7.9 million due to the sequential improvement in our profitability as well as the solid operating performance of our team. We used $2.6 million for capital expenditures.
U.S. Tariffs - Special Note
Like many companies, the recently imposed U.S. tariffs have imposed unanticipated costs on us. However, prior to the tariffs being imposed we had already begun to reengineer our supply chain model to align with our all-platform systems. The imposition of these trade tariffs has only caused us to accelerate these plans. We believe these tariffs and tariff-related costs will be significant, however we expect them to have a short-term effect on Calix. Therefore, we will exclude these costs from our non-GAAP guidance and results and we will call them out specifically in our GAAP results. We expect to incur significant U.S. tariff and tariff-related costs for the fourth quarter of 2018 and the first half of 2019, after which we expect them to diminish and be largely mitigated. In the fourth quarter of 2018, we anticipate incurring approximately $3.5 million in tariff and tariff-related costs, which will lower our GAAP gross margin by approximately 280 basis points and our GAAP net income by approximately $0.06 per diluted common share. In the first half of 2019, we expect to incur approximately $6.0 to $9.0 million in costs associated with the U.S. imposed tariffs.
As we believe we can mitigate these effects within a year, we have no plans to pass these costs onto our customers as it will only slow sales and distract our sales teams. Rather, we will continue our focus on ramping our all-platform offerings into the market and focus our energies on accelerating our supply chain transformation to align with our all-platform model. Most importantly, we expect to fully serve our customers throughout.
Fourth Quarter 2018 Guidance
Guidance Non-GAAP | Reconciliation of Guidance to GAAP | |
Revenue | $122 - $127M | $122 - $127M |
Gross margin | 46.0 - 48.0% (1) | 43.0 - 45.0% |
Operating expenses | $51.0 - $53.0M (1) | $53.2 - $55.2M |
Net income (loss) per diluted common share | $0.08 - $0.14 (1) (2) | ($0.02) - $0.04 (2) |
Operating cash flow | Negative | Negative |
(1) | Excludes the impacts from non-GAAP items such as stock-based compensation and U.S. tariff and tariff-related costs. |
(2) | Based on 54.5 million weighted-average diluted common shares outstanding. |
Our guidance for the fourth quarter of 2018 reflects our expectations as of the date of this letter. We expect to see positive benefits in the fourth quarter of 2018 from the continued ramp of our platform-based offerings. Specifically, Calix Cloud, AXOS E-series systems and our latest system family the EXOS GigaSpire. Even with this sequential growth, it will still be a challenging comparison with the year ago quarter as the prior year’s quarter included a heavy quarter of activity of a major CAF2 project for a key customer. We continue to expect the amount of remaining CAF2 work for this customer in 2018 to be significantly reduced as compared to 2017. As such, we expect that this trend will negatively impact our year-over-year revenue
5
comparisons for the fourth quarter of 2018. The team remains relentlessly focused on meeting customer requested delivery dates in the face of a somewhat challenging environment for some key components.
Our non-GAAP gross margin guidance for next quarter reflects our expectations of continued customer diversification and improved systems mix related to continued strong demand for our all-platform product offerings. In addition, we expect relatively consistent services gross margin as we align our offerings with our all-platform model and make some incremental investments in this regard.
Our non-GAAP operating expense guidance for next quarter reflects our continued focus on investment discipline along with our normal seasonal increases reflecting year-end commission accelerators and costs associated with our annual ConneXions conference.
Finally, we expect operating cash flow to decline next quarter relative to the just reported quarter as we invest significant capital into inventory to support the ramp of new products and help mitigate the impact of enacted tariffs.
Importantly, we remain committed to our long-term financial model. As a reminder, our long-term model produces a better than 10% operating margin at an annual revenue level of $600 million.
Summary
We made steady progress towards our mission in the third quarter, and as we continue to execute, we expect to see our fundamental performance continue to improve. Once again, we grew our customer base, expanded our gross margin and continued to demonstrate discipline in operating expense investment, all while growing revenue sequentially in a deliberate fashion. Furthermore, this marks the second consecutive quarter with all our financial metrics either within or better than our guidance ranges, demonstrating the increased predictability that results from our all-platform model.
Based on the results of this quarter, a sold out ConneXions 2018 and the strong pipeline of opportunities we see ahead of us, it is clear innovative service providers are looking to Calix to provide the platforms, solutions and services to enable them to improve their subscribers’ experience, thereby driving their revenue higher, lowering their churn and increasing ROI. With an expanding pipeline of opportunities spanning service providers of every type, we believe we are well placed to continue building Calix … an all-platform company … that is positioned in front of the largest wave of disruption our industry has experienced. We remain committed to our vision, and we sincerely thank our employees, customers and stockholders for their continued support as we capitalize on this opportunity.
Sincerely,
 Carl Russo President & CEO |  Cory Sindelar CFO |
6
Conference Call
In conjunction with this announcement, Calix will host a conference call at 2:00 p.m. Pacific Time (5:00 p.m. Eastern Time) today to answer questions regarding our third quarter 2018 financial results. A live audio webcast and replay of the call will be available in the Investor Relations section of the Calix website at http://investor-relations.calix.com.
Live call access information: Dial-in number: (877) 407-4019 (U.S.) or (201) 689-8337 (outside the U.S.)
The conference call and webcast will include forward-looking information.
Investor Inquiries
Thomas J. Dinges, CFA
Director of Investor Relations
408-474-0080
Tom.Dinges@calix.com
About Calix
Calix, Inc. (NYSE: CALX) - Innovative communications service providers rely on Calix platforms to help them master and monetize the complex infrastructure between their subscribers and the cloud. Calix is the leading global provider of the cloud and software platforms, systems and services required to deliver the unified access network and smart premises of tomorrow. Our platforms and services help our customers build next generation networks by embracing a DevOps operating model, optimize the subscriber experience by leveraging big data analytics and turn the complexity of the smart home and business into new revenue streams.
Forward-Looking Statements
Statements made in this stockholder letter and the earnings call referencing the stockholder letter that are not statements of historical fact are forward-looking statements. Forward-looking statements are subject to the “safe harbor” provisions of the Private Securities Litigation Reform Act of 1995. Forward-looking statements relate to, but are not limited to, statements about potential customer or market opportunities, industry, market and customer trends, opportunities with existing and prospective customers, the anticipated benefits from our supply-chain reengineering activities, the future impact, financial or otherwise, of the recent U.S. tariffs or any other tariffs or trade regulations that may be imposed whether by the United States or other countries, as well as our ability to effectively mitigate such impacts and future financial performance (including the outlook for the fourth quarter of 2018). Forward-looking statements are subject to risks and uncertainties that could cause actual results to differ materially from expectations, including but not limited to fluctuations in the Company’s financial and operating results, the capital spending decisions of its customers, changes and disruptions in the market and industry, changes in regulations and/or government sponsored programs, competition, its ability to achieve market acceptance of new products and solutions, its ability to grow its customer base, fluctuations in costs associated with its products and services including higher costs due to project delays and changes, cost overruns and other unanticipated factors, as well as the risks and uncertainties described in its annual reports on Form 10-K and its quarterly reports on Form 10-Q, each as filed with the SEC and available at www.sec.gov, particularly in the sections titled “Risk Factors.” Forward-looking statements speak only as of the date the statements are made and are based on information available to the Company at the time those statements are made and/or management’s good faith belief as of that time with respect to future events. Calix assumes no obligation to update forward-looking statements to reflect actual performance or results, changes in assumptions or changes in other factors affecting forward-looking information, except to the extent required by applicable securities laws. Accordingly, investors should not place undue reliance on any forward-looking statements.
Use of Non-GAAP Financial Information
The Company uses certain non-GAAP financial measures in this stockholder letter to supplement its consolidated financial statements, which are presented in accordance with GAAP. These non-GAAP measures include non-GAAP gross margin, non-GAAP operating expenses, non-GAAP net income (loss) and non-GAAP net income (loss) per diluted common share. These non-GAAP measures are provided to enhance the reader’s understanding of the Company’s operating performance as they primarily exclude certain non-cash charges for stock-based compensation, gain on sale of product line, restructuring charges (benefit) and U.S. tariff and tariff-related costs, which the Company believes are not indicative of its core operating results. Management believes that the non-GAAP measures used in this stockholder letter provide investors with important perspectives into the Company’s ongoing business performance and management uses these non-GAAP measures to evaluate financial results and to establish operational goals. The presentation of these non-GAAP measures is not meant to be a
7
substitute for results presented in accordance with GAAP, but rather should be evaluated in conjunction with those GAAP results. A reconciliation of the non-GAAP results to the most directly comparable GAAP results is provided in this stockholder letter. The non-GAAP financial measures used by the Company may be calculated differently from, and therefore may not be comparable to, similarly titled measures used by other companies.
8
Calix, Inc. | ||||||||||||||||||
Condensed Consolidated Statements of Operations | ||||||||||||||||||
(Unaudited, in thousands, except per share data) | ||||||||||||||||||
Three Months Ended | Nine Months Ended | |||||||||||||||||
September 29, | September 30, | September 29, | September 30, | |||||||||||||||
2018 | 2017 | 2018 | 2017 | |||||||||||||||
Revenue: | ||||||||||||||||||
Systems | $ | 104,992 | $ | 106,442 | $ | 300,846 | $ | 305,395 | ||||||||||
Services | 9,707 | 22,385 | 24,958 | 67,073 | ||||||||||||||
Total revenue | 114,699 | 128,827 | 325,804 | 372,468 | ||||||||||||||
Cost of revenue: | ||||||||||||||||||
Systems (1) | 54,354 | 55,494 | 160,350 | 171,166 | ||||||||||||||
Services (1) | 7,512 | 28,700 | 19,696 | 78,969 | ||||||||||||||
Total cost of revenue | 61,866 | 84,194 | 180,046 | 250,135 | ||||||||||||||
Gross profit | 52,833 | 44,633 | 145,758 | 122,333 | ||||||||||||||
Operating expenses: | ||||||||||||||||||
Research and development (1) | 21,111 | 32,633 | 68,748 | 99,391 | ||||||||||||||
Sales and marketing (1) | 20,722 | 18,448 | 61,150 | 59,306 | ||||||||||||||
General and administrative (1) | 10,481 | 10,203 | 29,947 | 30,161 | ||||||||||||||
Restructuring charges (benefit) | (157 | ) | 612 | 5,976 | 2,268 | |||||||||||||
Gain on sale of product line | — | — | (6,704 | ) | — | |||||||||||||
Total operating expenses | 52,157 | 61,896 | 159,117 | 191,126 | ||||||||||||||
Income (loss) from operations | 676 | (17,263 | ) | (13,359 | ) | (68,793 | ) | |||||||||||
Interest and other income (expense), net: | ||||||||||||||||||
Interest income (expense), net | (142 | ) | (60 | ) | (530 | ) | 88 | |||||||||||
Other income (expense), net | 360 | (305 | ) | 522 | (386 | ) | ||||||||||||
Total interest and other income (expense), net | 218 | (365 | ) | (8 | ) | (298 | ) | |||||||||||
Income (loss) before provision for income taxes | 894 | (17,628 | ) | (13,367 | ) | (69,091 | ) | |||||||||||
Provision for income taxes | 85 | 225 | 353 | 1,075 | ||||||||||||||
Net income (loss) | $ | 809 | $ | (17,853 | ) | $ | (13,720 | ) | $ | (70,166 | ) | |||||||
Net income (loss) per common share: | ||||||||||||||||||
Basic | $ | 0.02 | $ | (0.35 | ) | $ | (0.26 | ) | $ | (1.40 | ) | |||||||
Diluted | $ | 0.02 | $ | (0.35 | ) | $ | (0.26 | ) | $ | (1.40 | ) | |||||||
Weighted average number of shares used to compute | ||||||||||||||||||
net income (loss) per common share: | ||||||||||||||||||
Basic | 53,082 | 50,336 | 52,330 | 49,960 | ||||||||||||||
Diluted | 53,828 | 50,336 | 52,330 | 49,960 | ||||||||||||||
(1) | Includes stock-based compensation as follows: | |||||||||||||||||
Cost of revenue: | ||||||||||||||||||
Systems | $ | 123 | $ | 137 | $ | 376 | $ | 349 | ||||||||||
Services | 89 | 69 | 257 | 200 | ||||||||||||||
Research and development | 800 | 1,215 | 2,597 | 3,663 | ||||||||||||||
Sales and marketing | 830 | 816 | 2,465 | 2,581 | ||||||||||||||
General and administrative | 657 | 759 | 2,105 | 2,521 | ||||||||||||||
9
Calix, Inc. | ||||||||
Condensed Consolidated Balance Sheets | ||||||||
(Unaudited, in thousands) | ||||||||
September 29, | December 31, | |||||||
2018 | 2017 | |||||||
ASSETS | ||||||||
Current assets: | ||||||||
Cash and cash equivalents | $ | 53,033 | $ | 39,775 | ||||
Accounts receivable, net | 67,671 | 80,392 | ||||||
Inventory | 30,267 | 31,529 | ||||||
Prepaid expenses and other current assets | 10,640 | 10,759 | ||||||
Total current assets | 161,611 | 162,455 | ||||||
Property and equipment, net | 21,252 | 15,681 | ||||||
Goodwill | 116,175 | 116,175 | ||||||
Other assets | 1,987 | 759 | ||||||
$ | 301,025 | $ | 295,070 | |||||
LIABILITIES AND STOCKHOLDERS’ EQUITY | ||||||||
Current liabilities: | ||||||||
Accounts payable | $ | 32,792 | $ | 35,977 | ||||
Accrued liabilities | 57,052 | 49,279 | ||||||
Deferred revenue | 16,813 | 13,076 | ||||||
Line of credit | 30,000 | 30,000 | ||||||
Total current liabilities | 136,657 | 128,332 | ||||||
Long-term portion of deferred revenue | 18,108 | 20,645 | ||||||
Other long-term liabilities | 2,186 | 1,130 | ||||||
Total liabilities | 156,951 | 150,107 | ||||||
Stockholders’ equity: | ||||||||
Common stock | 1,462 | 1,421 | ||||||
Additional paid-in capital | 862,642 | 851,054 | ||||||
Accumulated other comprehensive loss | (740 | ) | (169 | ) | ||||
Accumulated deficit | (679,304 | ) | (667,357 | ) | ||||
Treasury stock | (39,986 | ) | (39,986 | ) | ||||
Total stockholders’ equity | 144,074 | 144,963 | ||||||
$ | 301,025 | $ | 295,070 | |||||
10
Calix, Inc. | ||||||||
Condensed Consolidated Statements of Cash Flows | ||||||||
(Unaudited, in thousands) | ||||||||
Nine Months Ended | ||||||||
September 29, | September 30, | |||||||
2018 | 2017 | |||||||
Operating activities: | ||||||||
Net loss | $ | (13,720 | ) | $ | (70,166 | ) | ||
Adjustments to reconcile net loss to net cash provided by (used in) operating activities: | ||||||||
Stock-based compensation | 7,800 | 9,314 | ||||||
Depreciation and amortization | 7,092 | 7,632 | ||||||
Amortization of intangible assets | — | 813 | ||||||
Loss on retirement of property and equipment | 311 | 148 | ||||||
Gain on sale of product line | (6,704 | ) | — | |||||
Changes in operating assets and liabilities: | ||||||||
Accounts receivable, net | 13,213 | 7,109 | ||||||
Inventory | (755 | ) | 8,224 | |||||
Prepaid expenses and other assets | (540 | ) | 11,584 | |||||
Accounts payable | (5,096 | ) | 5,543 | |||||
Accrued liabilities | 3,652 | (10,132 | ) | |||||
Deferred revenue | 398 | 1,310 | ||||||
Other long-term liabilities | (431 | ) | (4 | ) | ||||
Net cash provided by (used in) operating activities | 5,220 | (28,625 | ) | |||||
Investing activities: | ||||||||
Purchases of property and equipment | (5,561 | ) | (6,786 | ) | ||||
Purchases of marketable securities | — | (8,732 | ) | |||||
Sales of marketable securities | — | 5,051 | ||||||
Maturities of marketable securities | — | 24,841 | ||||||
Proceeds from sale of product line | 10,350 | — | ||||||
Net cash provided by investing activities | 4,789 | 14,374 | ||||||
Financing activities: | ||||||||
Proceeds from exercise of stock options | 79 | 29 | ||||||
Proceeds from employee stock purchase plans | 3,806 | 673 | ||||||
Taxes paid for awards vested under equity incentive plan | (53 | ) | (2,743 | ) | ||||
Proceeds from line of credit | 404,763 | 68,534 | ||||||
Repayment of line of credit | (404,763 | ) | (38,534 | ) | ||||
Payments to originate or amend the line of credit | (115 | ) | (186 | ) | ||||
Net cash provided by financing activities | 3,717 | 27,773 | ||||||
Effect of exchange rate changes on cash and cash equivalents | (468 | ) | 303 | |||||
Net increase in cash and cash equivalents | 13,258 | 13,825 | ||||||
Cash and cash equivalents at beginning of period | 39,775 | 50,359 | ||||||
Cash and cash equivalents at end of period | $ | 53,033 | $ | 64,184 | ||||
11
Calix, Inc. | ||||||||||||
Reconciliation of GAAP to Non-GAAP Results | ||||||||||||
(Unaudited, in thousands, except per share data) | ||||||||||||
Three Months Ended September 29, 2018 | ||||||||||||
Gross Margin % | Operating Expenses | Net Income Per Diluted Common Share | ||||||||||
GAAP amount | 46.1 | % | $ | 52,157 | $ | 0.02 | ||||||
Adjustments to GAAP amounts: | ||||||||||||
Stock-based compensation | 0.1 | % | (2,287 | ) | 0.04 | |||||||
Restructuring benefit | — | 157 | — | |||||||||
Non-GAAP amount | 46.2 | % | $ | 50,027 | $ | 0.06 | ||||||
Calix, Inc. | |||||||||||||||||||||
Reconciliation of GAAP to Non-GAAP Results | |||||||||||||||||||||
(Unaudited, in thousands) | |||||||||||||||||||||
Three Months Ended | |||||||||||||||||||||
September 29, | June 30, | March 31, | December 31, | September 30, | |||||||||||||||||
2018 | 2018 | 2018 | 2017 | 2017 | |||||||||||||||||
GAAP net income (loss) | $ | 809 | $ | (2,793 | ) | $ | (11,736 | ) | $ | (12,866 | ) | $ | (17,853 | ) | |||||||
Adjustments to GAAP amounts: | |||||||||||||||||||||
Stock-based compensation | 2,499 | 2,544 | 2,757 | 3,054 | 2,996 | ||||||||||||||||
Restructuring charges (benefit) | (157 | ) | 793 | 5,340 | 1,981 | 612 | |||||||||||||||
Gain on sale of product line | — | — | (6,704 | ) | — | — | |||||||||||||||
Non-GAAP net income (loss) | $ | 3,151 | $ | 544 | $ | (10,343 | ) | $ | (7,831 | ) | $ | (14,245 | ) | ||||||||
Calix, Inc. | ||||||||
Reconciliation of GAAP to Non-GAAP Guidance | ||||||||
(Unaudited, in thousands, except per share data) | ||||||||
Three Months Ending December 31, 2018 | ||||||||
Outlook | GAAP | Stock-Based Compensation | U.S. Tariff and Tariff-related Costs | Non-GAAP | ||||
Gross margin | 43.0% - 45.0% | 0.2% | 2.8% | 46.0% - 48.0% | ||||
Operating expenses | $ 53,200 - $ 55,200 | $ (2,200) | $ - | $ 51,000 - $ 53,000 | ||||
Net income (loss) per diluted common share(1) | $ (0.02) - $ 0.04 | $ 0.04 | $ 0.06 | $ 0.08 - $ 0.14 | ||||
(1) Based on 54.5 million weighted-average diluted common shares outstanding.
12